
As high-traffic multi-tenant platforms formulate their architectural roadmaps for transitioning from centralized origin clusters into globally distributed Edge Content Delivery Networks (CDNs), engineering teams face a critical research challenge: How do you design, capture, and synchronize terabytes of regional access logs and OpenTelemetry traces across future international edge nodes (Tokyo, Singapore, Frankfurt) without introducing WAN latency into user request paths?
1. The Edge Ingress Imperative: Moving Compute to the Consumer
In modern web infrastructure, serving dynamic Server-Side Rendered (SSR) React applications and static assets from a single North American data center introduces severe latency penalties for international audiences. A user in Tokyo (NRT) or Singapore (SIN) connecting to a US-West origin experiences 150ms–250ms of speed-of-light propagation latency per TCP/TLS handshake.
By deploying regional Edge POPs (Points of Presence) equipped with intelligent reverse-proxy caching, anycast routing, and local SSR execution, edge nodes terminate TLS connections locally in under 10ms, serving 90%+ of cacheable responses directly from local NVMe memory.
2. The Edge Telemetry Paradox: The Logging Dilemma
While edge caching accelerates content delivery, it creates a distributed observability problem. Every regional node processes thousands of HTTP requests per second, generating massive volumes of Nginx access logs, PM2 process metrics, and OpenTelemetry distributed traces.
Traditional logging models fail in multi-region edge environments:
- Synchronous Remote Logging (Anti-Pattern): Writing logs directly across the Pacific via synchronous network calls blocks the web worker, completely erasing the latency benefits of an edge node.
- Unbuffered Local Logging (Fragile): Storing logs purely on local edge disks without automated replication leaves operators blind if an edge instance terminates or experiences a regional network partition.
- Infinite Label Cardinality (The Loki Trap): Indexing dynamic parameters (such as unique
trace_idhex strings, client IPs, or query strings) as stream labels causes index chunk explosion, fragmenting storage into hundreds of thousands of tiny uncompressed files.
3. Industry Precedents: How Global Hyper-Scalers Solve Edge Logging
A. Cloudflare's Logpush & Micro-Batch Pipeline
Cloudflare processes tens of millions of HTTP requests per second across 300+ cities. Their edge architecture relies on in-memory ring buffers inside their core proxy daemon. Rather than emitting individual log lines over the wire, edge nodes micro-batch access records into compressed gzip blocks and flush them every 30 seconds over persistent HTTP/2 sessions directly to customer analytical data lakes (ClickHouse, BigQuery, S3).
B. Fastly's Non-Blocking Syslog Streaming
Fastly utilizes decoupled asynchronous logging pipes within their Varnish-based edge servers. Request worker threads append log records to lock-free memory buffers. A dedicated background transport daemon drains these buffers and streams encrypted syslog frames over TLS to central aggregation endpoints, ensuring zero impact on client TTFB.
C. Netflix Keystone & Edge Telemetry Hubs
Netflix's Open Connect CDN and AWS regional deployments funnel telemetry through Keystone, an Apache Kafka and Flink streaming backbone. Regional edge clusters buffer logs locally in Kafka topics before replicating asynchronously across AWS regions to central Elasticsearch and S3 cold storage archives.
4. The Modern Open-Source Blueprint: Decoupled Multi-Region Telemetry
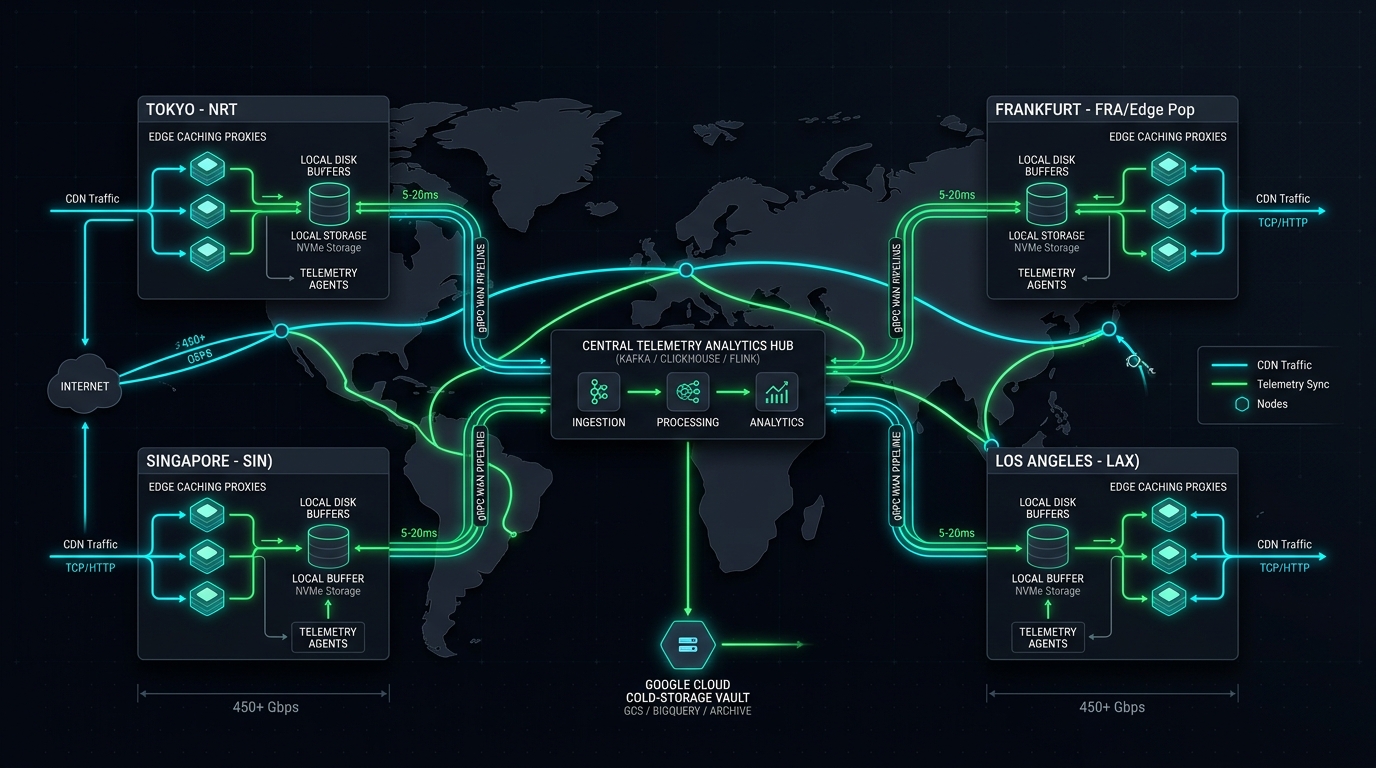
For high-performance custom platforms like multiDomainCMS, an optimal multi-region telemetry architecture utilizes a three-tier decoupled pipeline:
🌐 The 3-Tier Multi-Region Logging Pipeline
- Tier 1: Regional Edge Nodes (e.g. Tokyo, Singapore, Frankfurt): Nginx logs locally to high-speed NVMe scratch storage. A local Promtail/Vector agent tails files, applies strict low-cardinality labels (
job,node,domain,status), and buffers batches in local disk-backed write-ahead logs (WAL). - Tier 2: Asynchronous WAN Transit & Central Hub (Node .18): Edge agents stream compressed batches over mutual TLS (mTLS) gRPC tunnels to the central Loki/Prometheus/ClickHouse aggregator on Node
.18. If cross-continental connectivity drops, the edge WAL safely buffers logs locally without dropping a single byte. - Tier 3: Automated Offsite Cold-Storage Vault (30TB Google Drive / GCS via rclone): An automated archival daemon sweeps rotated log bundles and database snapshots older than 30 days, streaming encrypted compressed archives to high-capacity Google Cloud cold storage.
5. Cardinality Engineering: Keeping Distributed Telemetry Lean
The most vital lesson in distributed log aggregation is separating Index Labels from Searchable Log Content:
- Stream Labels (Low Cardinality): Only use predictable, bounded keys (e.g.
cluster_role="edge",node="tokyo-edge-01",domain="winwinhost.com"). This enables Loki to consolidate thousands of log lines into large, highly compressed 1MB chunks. - Structured Metadata (High Cardinality): High-cardinality attributes—such as
trace_id,remote_addr,request_uri, andhttp_user_agent—must remain inside the log line body or structured metadata fields. They remain 100% searchable via LogQL string matching without causing chunk explosion.
6. Frequently Asked Questions (FAQ)
How do edge nodes handle network disconnects between regions?
Edge telemetry agents utilize local disk-backed Write-Ahead Logging (WAL). If the WAN link to the central telemetry hub experiences packet loss or downtime, logs queue on the local NVMe disk and automatically catch up once connectivity is restored.
Why should trace_id not be used as a Loki stream label?
Because every HTTP request generates a unique trace ID, setting it as a stream label forces Loki to create a brand new chunk file for every single request, causing severe disk and memory churn. Storing it in the log payload preserves full searchability while allowing thousands of logs to compress into a single stream.