
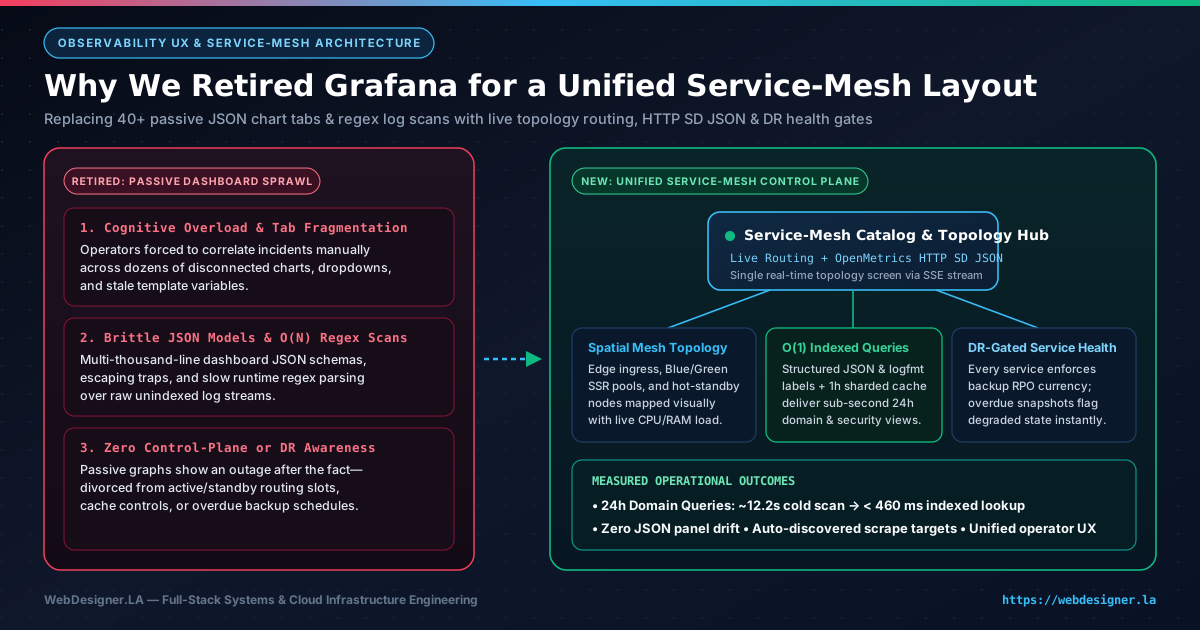
Today we officially retired Grafana from our daily infrastructure operations. That decision had nothing to do with abandoning time-series telemetry or structured logs—both remain essential—and everything to do with user experience. Over time, Grafana's folder-and-panel paradigm turned routine triage into a frustrating ritual of hunting across forty disconnected tabs, debugging broken template dropdowns, and babysitting multi-thousand-line JSON dashboard blobs. Replacing that sprawl with a unified, topology-first service mesh layout finally put live routing state, golden signals, and disaster-recovery readiness onto a single coherent screen.
Why Grafana's Dashboard UX Broke Down in Daily Operations
Grafana deserves credit for popularizing open-source metrics visualization a decade ago. When you only run three servers and a single database, dragging a few Prometheus queries onto a canvas feels productive. Yet as a multi-tenant platform grows to encompass edge proxies, Blue/Green application pools, asynchronous worker queues, mail pipelines, and distributed data stores, the classic dashboard-grid UX begins working against the human operator at the exact moment clarity matters most.
In my own day-to-day experience, three recurring UX failure modes convinced me it was time to move on:
- Severe Dashboard Fatigue and Tab Archaeology: Answering one practical operational question—such as whether an elevated latency spike originated at the edge proxy, a specific application pool, or a background worker—meant opening four separate dashboards, manually aligning time-range pickers, and praying that every top-bar template variable used the same label naming convention.
- Opaque, High-Friction JSON Panel Maintenance: Treating Grafana dashboards as code sounds clean in theory until you inspect the underlying artifacts: sprawling two-thousand-line JSON files packed with pixel grid coordinates, nested panel plugin schemas, and escaped query strings. Clicking "Save" in the browser UI creates noisy diffs, while editing JSON by hand invites subtle syntax regressions.
- Passive Charts Divorced from Operational Reality: A wall of green and orange line charts is purely observational. It cannot tell you at a glance which Blue/Green slot is actively serving production traffic, which warm standby node is ready to absorb a failover, or whether a service that looks "up" on HTTP pings is quietly overdue on its backup schedule.
The Core Observability UX Lesson: During a live incident, humans do not think in isolated panel IDs or folder hierarchies—we think in request paths and service dependencies. Any interface that forces an engineer to mentally stitch twelve separate time-series charts into a system map is shifting architectural work onto human working memory.
What Replaced It: A Topology-First Service Mesh Layout
As a full-stack systems and UX architect, I wanted our internal control plane to obey the same progressive-disclosure principles we build into client-facing commercial software. Instead of asking "Which dashboard folder holds the chart for this daemon?", the new service mesh layout opens directly onto a live spatial map of the entire architecture.
Every tier—edge ingress, active and standby web rendering pools, transactional APIs, background job runners, and storage clusters—renders as a first-class node in an interactive dependency graph streamed continuously via lightweight Server-Sent Events (SSE). You immediately see where traffic enters, which upstream pool holds the active routing lease, how CPU and memory headroom are distributed across nodes, and whether any dependency link is experiencing elevated error rates.
When something looks unusual, you do not open five new browser tabs. Selecting a service node expands its contextual telemetry drawer right inside the topology view—surfacing request throughput, p95 latency, process health, TLS posture, and filtered structured events without ever losing sight of its upstream callers or downstream databases.
Passive Chart Grids vs. Unified Service-Mesh Layout
Consolidating metrics, structured event streams, routing topology, and backup compliance into a single purpose-built interface eliminated both cognitive clutter and sluggish query round-trips.
Down from ~12.2 seconds on cold 24-hour domain scans after retiring unindexed regex panel queries.
Replaces 40+ scattered dashboard tabs and brittle dropdown variables with inline progressive disclosure.
No service can report healthy in the mesh unless its disaster-recovery backup schedule is current.
Retired Grafana Dashboard System
- 40+ disconnected chart tabs & folder trees High Friction
- Multi-thousand-line dashboard JSON diffs Brittle
- Full-text regex scanning across 24h logs ~12.2s Cold
- Blind to Blue/Green slots & stale backups Passive Only
Unified Service-Mesh Control Plane
- Live spatial dependency graph with inline drill-down Zero Tab Hop
- Auto-discovered topology via OpenMetrics HTTP SD Self-Updating
- Indexed stream labels & 1h sharded query caching < 460 ms
- Composite liveness + RPO backup currency gates DR Verified
Open Standards Under the Hood: Structured Discovery & O(1) Indexed Telemetry
Retiring Grafana did not mean inventing a closed monitoring silo or throwing away battle-tested open-source storage engines. Quite the opposite: keeping Prometheus-compatible time-series scraping and label-indexed log storage underneath while replacing the presentation and discovery layer let us lean harder into clean open standards—improving observability UX and query speed at the same time.
| Architectural Layer | Legacy Dashboard Bottleneck | Open-Standard Mesh Replacement | Operational Impact |
|---|---|---|---|
| Target Discovery | Hand-edited static scrape lists & drifting dashboard dropdowns | OpenMetrics HTTP Service Discovery (http_sd_configs) JSON feed |
New services and failover nodes appear in metrics & mesh views automatically with zero manual config edits. |
| Event & Log Filtering | Runtime regular-expression scans over raw unstructured log lines | Structured JSON / logfmt records with bounded O(1) indexed stream labels |
Eliminates full-chunk regex sweeps; 24-hour top-domain and security views resolve in under half a second. |
| Range Aggregations | Monolithic multi-panel queries competing on every browser refresh | 1-hour interval query splitting with parallel cached evaluation | Historical slices stay warm in memory; only the trailing live window computes fresh deltas. |
| Health Definition | Shallow HTTP 200 OK ping divorced from data durability |
Composite service health combining liveness, load, and RPO backup currency | Stale snapshots surface degraded status on the mesh before an outage ever tests recovery. |
1. Dynamic OpenMetrics HTTP Service Discovery
One of the quietest sources of observability rot in traditional setups is configuration drift between what is actually running in production and what your dashboards remember to query. Whenever a new microservice launched or a worker moved hosts, someone had to update static scrape configs and patch template filters across multiple Grafana panels.
By having our central service catalog publish the open Prometheus http_sd_configs JSON target format directly from live service registrations, discovery became completely zero-touch. Every registered service advertises its role, environment metadata, and telemetry capabilities in structured JSON. The time-series collector and the service mesh layout read from the exact same source of truth—meaning an instance can never exist in traffic without simultaneously appearing in the mesh topology.
2. Indexed Stream Labels Over Runtime Regex Scanning
While auditing why legacy Grafana dashboards felt sluggish whenever we widened the lookback window to 24 hours, the culprit was unmistakable: dozens of panels were running unanchored regular expressions across gigabytes of raw log text just to extract HTTP status codes, tenant hostnames, or security event types at query time.
Moving to strict structured JSON and logfmt emission allowed us to promote bounded, low-cardinality operational dimensions—such as status class, service role, and policy violation category—into O(1) indexed stream selectors while parsing structured fields natively without regex backtracking. Paired with 1-hour interval query splitting and parallel execution, a 24-hour cross-domain traffic query that previously stalled for roughly 12.2 seconds cold now returns in 456 ms cold and 370 ms warm.
3. Disaster-Recovery Currency as a First-Class Health Gate
Perhaps the biggest architectural upgrade in our new service mesh layout is redefining what "healthy" actually means. In a conventional monitoring dashboard, a database or stateful API with low CPU and fast responses glows bright green even if its automated offsite backup job quietly failed two nights ago.
In our unified mesh, disaster-recovery readiness is baked directly into service health. Every stateful and stateless component is governed by an explicit Recovery Point Objective (RPO) policy. If a service falls behind on its verified backup schedule, its disaster-recovery health gate trips immediately—shifting the node from healthy to degraded right on the primary mesh canvas so we remediate backup drift long before hardware trouble ever strikes.
When Grafana Still Makes Sense—and When to Build a Better UX
If your organization employs a dedicated observability team whose full-time job is authoring exploratory PromQL scratchpads for hundreds of internal squads, a general-purpose charting workbench like Grafana still has a place. But for lean, high-velocity engineering teams operating high-availability cloud hosting and multi-tenant web platforms, fighting a clunky third-party dashboard UI every day is an unnecessary tax on focus.
Retiring Grafana taught us a simple lesson that applies just as strongly to internal developer tools as it does to commercial e-commerce storefronts: good UX reduces cognitive load when stakes are high. Replacing forty passive JSON chart tabs with one live, standards-driven service mesh layout gave us faster queries, stronger disaster-recovery discipline, and an operational interface we actually enjoy opening. If your team is drowning in dashboard sprawl or looking to modernize a mission-critical web platform, feel free to schedule an architecture consultation or reach out at info@webdesigner.la.