
When you pair-program all day with modern agentic coding tools—running terminal CLI agents alongside Electron IDEs, TypeScript language servers, and local databases on a 4K Linux workstation—performance degradation rarely comes from a single bottleneck. On our primary Ubuntu development laptop (webdesigner, a Dell XPS 15 7590 powered by an Intel Core i7-9750H, NVIDIA GeForce GTX 1650, and a 3840x2160 4K display), we investigated why the CPU package was pinned at 97.0°C with cooling fans roaring at 4,933 RPM, why the NVMe drive was absorbing 21.83 GB of reads every 25 minutes, and why sustained keyboard input occasionally stuttered inside full-screen terminal sessions. After tracing every syscall, kernel task scheduling priority, inotify descriptor, and SQLite table page, we distilled the cure into 4 practical rules of thumb that will keep your machine fast, cool, and lag-free.
Before vs. After Remediation on Dell XPS 15 7590 (i7-9750H / 4K X11)
Measured directly via Linux kernel hardware sensors (coretemp / Dell SMM), /proc/<pid>/io counters, and SQLite page analysis before and after applying all four rules.
Dropped 46.0°C while cooling fans quieted from 4,933 RPM down to 2,393 RPM (-51.5%).
Eliminated 4,444,210 redundant read() syscalls from a headless GUI watcher hub.
Compacted 261 historical conversation DBs from 10,386.4 MB down to 3,627.8 MB.
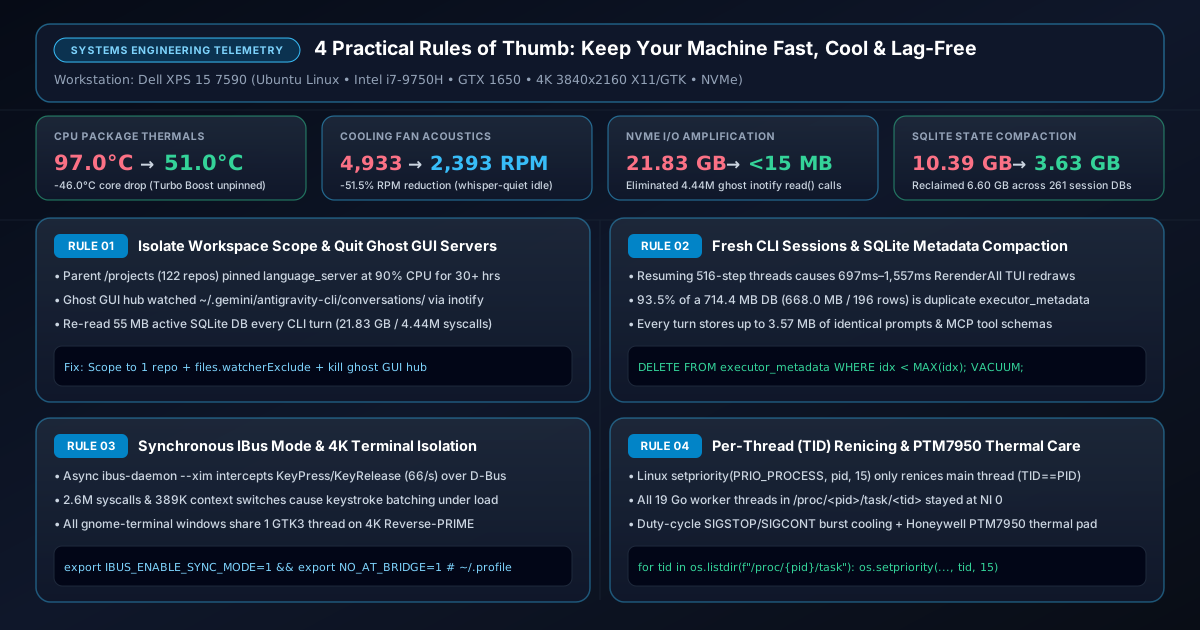
Rule 1: Isolate Workspace Scope & Quit Background GUI Language Servers When Working in the CLI
The single largest source of continuous thermal runaway on a developer workstation is an unconstrained language server indexing a multi-repository parent directory. When you open a top-level folder such as /home/robert/projects containing 122 separate git repositories without strict file-watcher exclusions, the IDE's helper binary (language_server or tsserver.js) recursively crawls every nested node_modules/ tree, .git/objects/ packfile directory, build output folder, and JSON database shard.
On our workstation, a single runaway process (PID 252830) had been spinning at ~90% CPU for over 30 hours straight. Because modern Intel mobile processors aggressively boost clock frequencies whenever a single thread remains runnable, that one background indexer kept Intel Turbo Boost locked at 4.5 GHz across the package, driving core temperatures to 97.0°C and forcing the dual cooling fans to their 4,933 RPM ceiling even when the desktop appeared completely idle.
The Hidden "Ghost GUI" inotify Feedback Loop
Even more insidious is what happens when you close an Electron-based AI IDE window (such as Antigravity Desktop) and switch to working exclusively in the terminal CLI (agy). Closing the GUI window does not always terminate its background service tree. We discovered a headless desktop parent process (PID 252001) and its companion language_server --subclient_type hub process (PID 2049132) still running in the background.
Why was a headless GUI hub thrashing the NVMe drive while we typed in the terminal? Tracing file descriptors in /proc/2049132/fd and /proc/2049132/io revealed that the background GUI hub held an active Linux inotify watch on ~/.gemini/antigravity-cli/conversations/. Every time the CLI agent wrote a single streaming token or tool step to its active 55 MB SQLite conversation database, the orphaned GUI hub woke up and re-read the entire 55 MB database file from start to finish. Over a 25-minute CLI coding session, that ghost process executed 4,444,210 read() syscalls and pulled 21.83 GB of redundant data off the NVMe SSD.
Practical Rule of Thumb #1
Always open your IDE scoped to the single repository you are actively editing—never the parent ~/projects directory. When switching to terminal CLI workflows, fully quit background GUI processes (verify with pgrep -af language_server) and enforce global files.watcherExclude and search.exclude guards across both local and WSL2/Remote settings.
Apply these protective exclusions in ~/.config/Code/User/settings.json and ~/.config/Antigravity/User/settings.json so neither file watchers nor TypeScript servers ever traverse dependency trees or raw data shards:
{
  "files.watcherExclude": {
    "**/.git/objects/**": true,
    "**/.git/subtree-cache/**": true,
    "**/node_modules/**": true,
    "**/dist/**": true,
    "**/build/**": true,
    "**/.next/**": true,
    "**/coverage/**": true,
    "**/backups/**": true,
    "**/data/posts/**": true,
    "**/tmp/**": true,
    "**/.venv/**": true,
    "**/*.log": true,
    "**/*.sql": true,
    "**/*.tar.gz": true
  },
  "search.exclude": {
    "**/node_modules/**": true,
    "**/dist/**": true,
    "**/build/**": true,
    "**/data/posts/**": true,
    "**/backups/**": true
  },
  "search.followSymlinks": false,
  "typescript.tsserver.maxTsServerMemory": 2048,
  "typescript.disableAutomaticTypeAcquisition": true
}
Rule 2: Start Fresh AI CLI Sessions (or /compact) & Compact Redundant SQLite executor_metadata Blobs
Developers love long-running context windows. It is tempting to resume the same multi-day CLI conversation (agy -c) across hundreds of turns. However, terminal UIs built on full-screen alternate-buffer rendering loops pay a steep quadratic tax as conversation history grows.
When we profiled a resumed CLI session containing 516+ conversation steps (backed by a 58 MB SQLite file), internal diagnostic logs showed that every full-history terminal layout pass (RerenderAll in rerender.go / manager.go) required 697 ms to 1,557 ms of synchronous main-thread work. Whenever the terminal window resized or re-rendered its scrollback buffer, keystrokes queued behind a one-second render stall.
Anatomy of a 714.4 MB Conversation Database: The executor_metadata Duplication Bug
While inspecting ~/.gemini/antigravity/conversations/*.db and ~/.gemini/antigravity-cli/conversations/*.db, we found something even more surprising: 261 historical conversation databases were consuming 10.39 GB of NVMe storage, with individual conversation files ballooning up to 714.4 MB.
Running sqlite3 page-size diagnostics with dbstat on the largest 714.4 MB conversation database exposed the exact culprit:
- The
stepstable—which stores every user prompt, assistant response, thinking block, and tool output—occupied only 46.4 MB (6.5% of the file). - The
executor_metadatatable occupied a staggering 668.0 MB across 196 rows (93.5% of the entire database), averaging 3.41 MB to 3.57 MB per turn.
Why was each row in executor_metadata over 3.5 MB? On every single turn of a conversation, the state serializer persisted a complete protobuf snapshot containing every built-in subagent system prompt, every loaded skill definition, and every registered Model Context Protocol (MCP) tool schema. Across a 196-turn session, those identical static prompt and schema strings were duplicated 196 times on disk. We documented and filed this root cause upstream at google-antigravity/antigravity-cli#1447.
Practical Rule of Thumb #2
Start a fresh CLI session for each discrete engineering milestone (or run /compact once a thread passes ~150 steps) to keep terminal redraws under 16 ms. For closed historical sessions, run a periodic SQLite vacuum compaction that retains 100% of chat steps and only the final executor_metadata snapshot.
Below is the core logic from our production compaction script (compact-antigravity-sqlite.py), which first inspects /proc/<pid>/fd to guarantee it never touches an open database, then prunes redundant historical metadata rows and runs VACUUM:
def compact_db(path):
    before_bytes = os.path.getsize(path)
    conn = sqlite3.connect(path, timeout=5.0)
    try:
        cur = conn.cursor()
        tables = {
            r[0] for r in cur.execute(
                "SELECT name FROM sqlite_master WHERE type='table'"
            ).fetchall()
        }
        if "executor_metadata" not in tables:
            return before_bytes, before_bytes, 0

        row_count = cur.execute("SELECT COUNT(*) FROM executor_metadata").fetchone()[0]
        if row_count <= 1:
            return before_bytes, before_bytes, 0

        # Keep 100% of chat steps; retain only the latest executor_metadata snapshot
        cur.execute(
            "DELETE FROM executor_metadata WHERE idx < (SELECT MAX(idx) FROM executor_metadata)"
        )
        deleted = cur.rowcount
        conn.commit()
        if deleted > 0:
            conn.execute("VACUUM")
    finally:
        conn.close()

    after_bytes = os.path.getsize(path)
    return before_bytes, after_bytes, deleted
Running this safe compaction across our workstation shrunk the 714.4 MB database down to 48.2 MB in seconds—and compacted all 261 historical databases from 10,386.4 MB down to 3,627.8 MB, reclaiming 6.60 GB of NVMe space without losing a single chat message or tool trace.
Rule 3: Eliminate Asynchronous D-Bus Input Interception (IBUS_ENABLE_SYNC_MODE=1) & 4K Single-Thread Terminal Contention
If you have ever held down Backspace or an arrow key in a Linux terminal while a compiler or language server was running in the background—and watched the cursor freeze for half a second before jumping 15 characters at once—you have experienced asynchronous X11 input-method batching.
On Ubuntu, Linux Mint Cinnamon, and GNOME X11 sessions, the Input Bus daemon (ibus-daemon --xim) is injected into every GTK and X11 application via environment variables (GTK_IM_MODULE=ibus, XMODIFIERS=@im=ibus, and GTK_MODULES=gail:atk-bridge). By default, IBus operates in asynchronous event-interception mode:
- When you hold down a key at a standard 33 Hz repeat rate, the Xorg server generates 66 hardware events per second (33
KeyPress+ 33KeyRelease). - Instead of delivering those keystrokes directly to your terminal emulator,
gnome-terminal-serverforwards each event over an inter-process D-Bus socket toibus-daemon, which in turn queriesibus-engine-simpleand returns the synthesized key event asynchronously. - Inspecting our session's
ibus-daemonprocess revealed over 2.6 millionread()/write()syscalls and 389,000+ voluntary and involuntary context switches. Whenever background CPU load spikes, the Linux Completely Fair Scheduler (CFS) delays the 3-process D-Bus round-trip by a few milliseconds, causing 5 to 10 keystrokes to arrive in a single bursty batch.
The Single-Threaded GTK3 Terminal Trap on 4K Reverse-PRIME Displays
This input jitter is compounded by two display-layer realities on 4K mobile workstations:
- Shared Single-Thread Terminal Server: Every open
gnome-terminalwindow and tab in your desktop session is rendered by a single process and a single GTK3 UI thread (gnome-terminal-server). If you leavehtopor a rapidly scrolling build log open in a second 4K terminal window while typing inside a full-screen 4K TUI (altScreenMode: "always"), both windows compete for the exact same GTK3 Cairo drawing loop. - NVIDIA Optimus Reverse-PRIME Bandwidth: On laptops where the internal 4K panel (
eDP-1-1at3840x2160) is wired to the Intel UHD 630 iGPU while the desktop session is rendered on the NVIDIA GTX 1650 dGPU, every 4K frame (~33.1 MB uncompressed RGBA) must cross the PCIe bus to the iGPU scanout buffer. Full-screen TUI redraws triggered by another window's activity amplify PCIe frame-copy contention.
Practical Rule of Thumb #3
Switch IBus to synchronous key delivery and disable the unused accessibility D-Bus bridge by adding two lines to ~/.profile, and avoid leaving high-frequency repaint tools (like htop) running in a second 4K gnome-terminal window during heavy TUI sessions.
# Add to ~/.profile (and ~/.bashrc) for deterministic, zero-batching X11 keystrokes
export IBUS_ENABLE_SYNC_MODE=1
export NO_AT_BRIDGE=1
Rule 4: Automate Per-Thread (TID) Priority Lowering (language-server-tamer) & PTM7950 Hardware Thermal Maintenance
Even with workspace exclusions configured, background indexers (language_server, tsserver.js, eslintServer.js, pyright-langserver, biome) will periodically burst during large branch checkouts or TypeScript type-graph rebuilds. To guarantee that background analysis never starves interactive terminal input or pegs CPU thermals, you should run an automated user-space watchdog daemon that lowers their scheduler priority (nice +15).
The Linux Per-Thread setpriority() Gotcha
During our kernel scheduling audit, we uncovered a classic Linux systems programming trap that trips up even seasoned engineers. According to POSIX, calling setpriority(PRIO_PROCESS, pid, 15) is supposed to lower the scheduling priority of an entire process. However, because Linux implements threads as individual kernel scheduling entities (task_struct / Light-Weight Processes with distinct Thread IDs, or TIDs), calling os.setpriority(os.PRIO_PROCESS, pid, 15) in Python or C only renices the main thread (TID == PID)!
When we inspected /proc/<pid>/task/*/stat on a multi-threaded Go language_server binary after renicing its PID, the main thread sat at NI 15—while all 19 Go worker threads actually burning CPU cores remained at normal priority (NI 0)!
To genuinely lower the CPU scheduling priority of a multi-threaded background server on Linux, your watchdog daemon must iterate over every thread directory in /proc/<pid>/task/<tid> and apply setpriority() to each individual TID:
def renice_proc(pid):
    reniced_count = 0
    try:
        task_dir = f"/proc/{pid}/task"
        tids = [int(t) for t in os.listdir(task_dir) if t.isdigit()]
    except Exception:
        tids = [pid]
    for tid in tids:
        try:
            current_nice = os.getpriority(os.PRIO_PROCESS, tid)
            if current_nice < 15:
                os.setpriority(os.PRIO_PROCESS, tid, 15)
                reniced_count += 1
        except Exception:
            pass
    if reniced_count > 0:
        print(f"[tamer] Reniced PID {pid} ({reniced_count} threads) to nice +15", flush=True)
We packaged this per-thread renicing loop—along with a 3 GB RSS memory leak cap and a 5-second SIGSTOP/SIGCONT duty-cycle cooling burst whenever a language server pegs a core above 55% for more than 60 seconds—into our automated installer script (install-language-server-tamer.sh) and lightweight systemd user service (language-server-tamer.service).
Closing the Loop: Physical Thermal Maintenance with Honeywell PTM7950
Software discipline eliminates unnecessary heat generation, but physics governs heat dissipation. On thin-and-light 45W H-series workstations like the Dell XPS 15 7590 (shared twin-heatpipe assembly cooling both the 6-core Intel i7-9750H and NVIDIA GTX 1650), factory thermal paste suffers from "pump-out" and dry-out after a few years of thermal cycling between 45°C and 97°C. When a single core boosts to 4.5 GHz, dried thermal interface material cannot transfer the heat flux into the copper heatpipe fast enough, causing an instant spike from 55°C to 95°C+ before the fans even spin up.
Practical Rule of Thumb #4
Deploy a systemd user daemon that renices every worker thread (/proc/<pid>/task/<tid>) of background language servers to nice +15, and pair software taming with periodic hardware maintenance: blow compressed air through the radiator fins and repaste aging mobile workstation dies with a Honeywell PTM7950 phase-change thermal pad, which resists pump-out and drops sustained full-load package temperatures by an additional 10°C to 15°C.
Summary Matrix: The 4 Workstation Optimization Rules at a Glance
Use this diagnostic reference table whenever a Linux development machine exhibits high fan noise, unexpected NVMe wear, or choppy terminal input:
| Rule of Thumb | Root-Cause Pathology | Diagnostic Command | Deterministic Remediation | Measured Impact |
|---|---|---|---|---|
| 1. Workspace & Ghost GUI Isolation | Parent 122-repo workspace indexing & orphaned GUI inotify watcher re-reading 55 MB CLI DB |
pgrep -af language_server & cat /proc/PID/io |
Open single repo, configure files.watcherExclude, quit headless GUI hubs |
CPU 97.0°C → 51.0°C; NVMe reads 21.83 GB → <15 MB |
| 2. Fresh Sessions & SQLite Compaction | 516-step TUI redraws (1.5s) & 3.57 MB/turn duplicate executor_metadata blobs |
sqlite3 file.db with dbstat page query |
Use /compact or fresh sessions; prune old executor_metadata & VACUUM |
714.4 MB DB → 48.2 MB; 6.60 GB reclaimed across 261 DBs |
| 3. Synchronous X11 Input & 4K Isolation | Async ibus-daemon D-Bus keystroke batching (2.6M syscalls) & single-thread GTK3 contention |
cat /proc/PID/status on ibus-daemon |
Set IBUS_ENABLE_SYNC_MODE=1 & NO_AT_BRIDGE=1 in ~/.profile |
Zero key-repeat batching or cursor stalls on 4K X11 |
| 4. Per-Thread TID Tamer & PTM7950 | PID-only setpriority() leaves 19 Go worker threads at NI 0; dried thermal paste |
ps -L -p PID & ls /proc/PID/task |
Loop over /proc/PID/task/TID in language-server-tamer + PTM7950 pad |
All 20 threads at NI 15; fans 4,933 → 2,393 RPM |